A right is actually an abbreviation for the full form “Right of first refusal”. It is an option given to the existing shareholders to invest in a public issue of the company in proportion to their existing shareholding.
It is given as a privilege to the current investors to increase their holding in the company. You can think of it as a loyalty program of sorts. The option’s time value (subscription period) in India is between 15 – 30 days depending on the company. It cannot extend beyond 30 days as per the securities law.
The right to subscribe is non-transferable and if shareholders don’t do it within the stipulated time-frame, it expires. To lure shareholders to buy in the rights issue, companies issue shares at a discount to the market price. The long-term shareholders tend to subscribe for these issues if they don’t want their % ownership of the company to get diluted.
Why do companies do Right issue?
The main reason is to keep its shareholding structure unchanged!
Rights issues are a classic way to keep away from new activist investors, hostile acquiring attempts from competitors, corporate raiders etc. Unlike an IPO, a rights issue is a silent affair which does not attract any attention of the outside world.
A company that wants to do a rights issue must only issue a public notice in 3 newspapers (English, Hindi & regional). Usually, these advertisements are stuck in the notice board part of the paper which hardly invites any attention.
This source of funding is especially useful for companies that have a large promoter holding with a narrow shareholder base. Raising equity becomes easy and inexpensive through this route.
Net asset value(NAV) is the value of a fund’s asset less the value of its liabilities such as operating expenses, marketing expenses, management fees, among other permissible expenses and charges per unit. NAV = (Value of Assets-Value of Liabilities)/number of units outstanding.
Let us assume I run a company. I have a factory, land property across the country, 100 Four Wheeler vehicle, 25 heavy pieces of machinery and I have borrowed a loan of Rs. 100/- from a bank. The company has 100 shares outstanding in the market.
The value of a factory is Rs. 1000/-, the value of a land property is Rs. 200/-, the value of 100 four wheeler vehicle is Rs. 100/- and the value of 25 heavy pieces of machinery is Rs. 500/-.
So my company’s total asset is = 1000 + 200 + 100 + 500 = Rs.1800/-
Since I have borrowed Rs. 100/- from the bank this is my liability which is to be repaid whether in the long term or short term.
So the company NAV is = 1800-100/100 = 1700/100 = 17
How to calculate the Fund NAV: The Mutual Fund invests the money in many different sectors and a bunch of companies to minimize the risk and diversify the portfolio.
Let us assume one large cap fund invests the money in 5 companies. So the companies NAV is different. To calculate the fund NAV you have to sum the respective company NAV and just average. Then you get the respective fund NAV. The companies in which the money is invested are Maruti Suzuki (NAV 400), Titan Company (NAV 300), State Bank of India (NAV 500), HPCL (NAV 500), and Interglobe Aviation ( NAV 300).
So, the Fund NAV is = ( 400 + 300 + 500 + 500 + 300 )/ 5 = 400.
A mutual fund is a professionally-managed trust that pools the savings of many investors and invests them in securities like stocks, bonds, short-term money market instruments and commodities such as precious metals.
Mutual funds are classified in a variety of ways. But the first classification is:
Open-ended funds: These funds buy and sell units on a continuous basis and, hence, allow investors to enter and exit as per their convenience. The units can be purchased and sold even after the initial offering (NFO) period (in case of new funds). The units are bought and sold at the net asset value (NAV) declared by the fund.
The number of outstanding units goes up or down every time the fund house sells or repurchases the existing units. This is the reason that the unit capital of an open-ended mutual fund keeps varying. The fund expands in size when the fund house sells more units than it repurchases as more money is flowing in.
Closed-ended funds: The unit capital of closed ended funds is fixed and they sell a specific number of units. Unlike in open-ended funds, investors cannot buy the units of a closed-ended fund after its NFO period is over. This means that new investors cannot enter, nor can existing investors exit till the term of the scheme ends. However, to provide a platform for investors to exit before the term, the fund houses list their closed-ended schemes on a stock exchange.
Trading on a stock exchange enables investors to buy and sell units through a broker in the same manner as transacting the shares of a company. The number of outstanding units of a closed-ended fund does not change as a result of trading on the stock exchange. The closed-ended funds are free from the worry of regular and sudden redemption and their fund managers are not worried about the fund size
When a company issues shares to the public, it raises its capital and allots shares to the shareholders. Buyback is exactly opposite to this. In Buyback, the company purchases its own shares from the shareholders and pays them the money.
Advantages to the retail investors:
Increase in the wealth of the retail investor:
Whenever a company announces buy back, it is generally done at a price higher than the market price of the shares. Hence, buyback is profitable from the view point of a retail investor. Also, for an already existing investor, buy back will be more beneficial because as the company announces buyback, it is generally perceived as a good sign and hence there is a renewed buying in the share. This causes the price of the share to increase and hence it increases the wealth of the investor.
However, there are few things which must be kept in mind before giving your shares to the company for buyback.
What is the % of the shares the company is willing to buy back? This matters the most because not all the shares held by the investor will be bought back by the company. Hence, the acceptance ratio matters a lot. If the ratio is low, then it would be prudent not to invest in the share only to get the benefit of buyback. Hence, the buyback will not be attractive option for a new investor who is thinking of purchasing the share after the company announces buyback if the acceptance ratio is low. But, for an existing old investor, who already holds the shares, the buy back announcement may be beneficial as he is already holding the shares because the company will be buying the shares at a price which is higher than the market price.
What is the price of the buy back? If the buyback price is less attractive, then again it won’t be prudent to invest in the shares with the greed of buyback by the company. Les attractive here would mean that the existing market price and the price of buy back are not having much difference.
The Bonus shares refers to the distribution of company’s reserves to the equity shareholders by giving them ‘extra’ shares on the basis of their previously held shares. Thus giving bonus shares is a sign of positive financial status of a company.
Advantage to the retail investor:
Increase in the wealth of the retail investor:
Before we go to this part, let me tell you a different story. ‘Two halves are more than one full’.
You and your friend go to a restaurant. You both decide to order ‘one’ lip smacking tomato soup. But then you decide to place an order for ‘two’ half tomato soups instead of ‘one’ full tomato soup. More often than not the quantity of two halves combined will be more than one full. This same psychological thing happens when a company declares bonus.
Say a company has a share price of Rs.1000. It decides to give bonus shares in the ratio of 1:1. Thus a member with 100 shares will now have 200 shares. Logically speaking the share price must reduce to half at Rs.500. However, the psychological thing comes into play. Thus, the stock price is adjusted to a little more than Rs.500. Not just this, there will be more volume as the shares are trading at lesser price. Hence, the shareholders would be rewarded.
Tax planning:
Before we go into the details, there are few basics which everyone needs to know:
If the shares are held for more than one year, the gain arising shall be long term. Otherwise, it shall be considered as short term.
In case of long term capital gain on sale of shares on a recognized stock exchange where STT (Securities Transaction Tax) is paid, the gain shall be exempt to the extent of Rs.1 lakh per annum.
However, if the gain in the above case is short term, then tax shall be levied at 10% of the gain.
Shares are taxed on FIFO (First In First Out) basis. Simply speaking, the shares bought first shall be adjusted first while selling.
Consider this example,
Here, the investor originally had 100 shares on 1.1.18 bought at Rs.150 a piece. As the company announced bonus shares, the total shares doubled to 200.
Now, whenever a company announces bonus, the investor must sell half of the shares the next day the bonus is allotted. Selling them early would result into short term loss. The remaining half shares must be held for more than one year. This will make the gain as long term.
In the table above, the investor did the same. He sold only 100 shares on 1.6.18 at Rs.75. The buying price on 1.1.18 was Rs.150. When the company announced bonus the shares doubled but the share price was reduced to half.
Now, as per FIFO, the 100 shares sold on 1.6.18 at Rs.75 will be assumed to be the shares bought first on 1.1.18 at Rs.150. This will result into short term capital loss of Rs.75 per share. Therefore, the total short term loss shall be Rs.7500. This loss can be adjusted against other short term capital gain and one can reduce the short term capital gain tax liability which otherwise would have been taxed at 10%. The remaining 100 shares must be sold after 1 year to turn them into long term and this will now help one in claiming exemption of Rs.1 lakh.
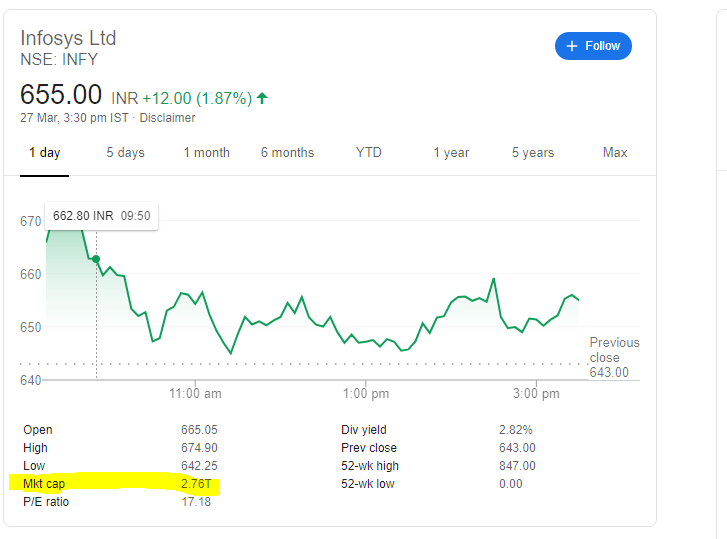
Market capitalization is nothing but the total number of outstanding shares of a company multiplied by the market price per share.
Sounds quite easy, doesn’t it? But there is more to the concept of market capitalization than just the above basic definition.
Market capitalization of a stock shows the size of the company and most of the times, the volatility of a stock depends on its market capitalization.
Let me put this in a different way.
So we have three images. Image A- a bike, Image B- a car and Image C- a truck. If I ask you a simple question as to which of these is easy to push in case these vehicles are stuck, the answer would be the bike, then the car and the most difficult to push would be the truck.
You see this is very much comparable to the market capitalization of the stocks.
Image A depicts stocks with smaller capitalization. Image B depicts stocks with medium capitalization and Image C represents the stocks with large capitalization. The people pushing these vehicles are the investors. The more they push the more the vehicle move ahead. If they stop pushing it, the vehicle would move back.
CASE A- Pushing the bike
A bike requires one or two people to push and can be very easily pushed. So is the case with small cap stocks. A lot lesser number of investors can lift the stock up or bring it down.These small cap stocks show great movement both upwards and downwards. Hence, they tend to be more volatile. For the same reason when such small cap stocks are performing really well, they can turn out to be potential multibagger. But then again, these are high beta stocks and they are riskier than the blue chip large cap stocks.
CASE B- Pushing the car
A car requires more people than a bike to push it. Hence again this is comparable to mid cap stocks. These too tend to be more volatile than the large cap stocks. But they tend to give fancier returns than the large cap stocks.
CASE C- Pushing the truck
A truck requires many people to push it. The behavior of large cap stocks is akin to this. The large cap stocks require lot of investors showing great deal of interest in them for it to show a big move both ways. So, even if few investors sell the stock, the stock won’t fall much. The same is true the other way round as well. The stock won’t go up a lot if few investors buy it. Hence, these stocks are less riskier than the small and mid cap stocks. People who hate the volatility in the stock market and are having conservative approach of investing their money generally invest in large cap stocks. They tend to be safer bet as compared to the small or mid cap stocks.
Before we understand these two concepts, let me explain you these two terms:
Face Value: It is nothing but the nominal value of the share so fixed by the company in the beginning. It is the value at which the company registers itself initially. It won’t change daily with the market forces.
Market Price: It is the price at which the share is trading in the stock exchange. It is always fluctuating depending on buyer(s) and seller(s).
The Market Price of Infosys ltd. is around Rs.1400 whereas its Face Value is only Rs.5.
Okay, another small basic economic concept which one must know.
More the supply, lesser would be the Market Price. Less the supply, more would be the Market Price.
Stock Split
Say, you have a rectangular piece of chocolate. It was worth Rs.10. You decide to cut this into two equal parts. So now, you have two pieces of chocolate each worth Rs.5.
This is what happens in case of a Stock Split. The company going for a stock split will reduce its ‘Face Value’ and the number of shares would increase proportionately.
Say, a company has issued 1 lakh shares of Face Value Rs.10 and the Market Price is Rs.500.
If the company is going for stock split and say the Face Value is reduced to Rs.5, then the total shares would increase to 2 lakh. Also, the Market Price would be adjusted as the supply of the share has now doubled.
That’s all about the stock split.
Bonus
Bonus is something completely different from Split.
Say, I have 1 chocolate and now I am getting 1 free on this chocolate, so now I have 2 chocolates. This is how Bonus shares work.
Say, a company has issued 1 lakh shares of Face Value Rs.10 and the Market Price is Rs.500.
Now, if the company declares Bonus of 1:1, then every shareholder will get 1 extra share for 1 share held. This would double the number of shares. Here, the Face Value shall not change. It is intact at Rs.10.
If you remember the above concept, you will now know that the supply of share has doubled and hence the Market Price will also proportionately get adjusted to half.
What difference will it make to a shareholder?
The total market valuation of all the shares in totality held by the shareholder in case of Stock Split and Bonus will remain the same as before and technically it actually won’t make much of a difference to a shareholder.
But, in case of Bonus Share, you have extra shares with the same Face Value and when a company declares dividend, it is always declared on Face Value. Hence, a Shareholder will get double dividend as compared to the one in case of a Stock Split.
Hence, for a shareholder’s point of view, Bonus is more rewarding than a Stock Split.
Say, you are driving a car. You start the engine and put the car in first gear. The car runs smoothly till the speed reaches 20 km/hr. No much harder you try, the car speed won’t increase unless you change the gear.
Now, you change the gear and the car is in the second gear. Due to this, the speed limit has increased to say 30 km/hr. And if now you want to increase the speed further, you need to shift the gear to the higher side.
This is what happens to a stock in stock market. A stock which is moving up, will go up till it reaches a level where it has exhausted. This is called as ‘Resistance Level’. When we say that a stock price is showing resistance, it means that the stock has shown signs that it will not go up further. At resistance, one needs to sell the stock because it has little room left to run further.
However, when a stock crosses resistance, it means that it has entered into a new zone. Hence, there will be more chance of it moving further up. This is akin to the car shifting the gear to a higher number and hence the car can increase the speed till the limit is exhausted.
Whenever a stock reaches its 52 weeks high (which means the highest price in past one year), there will be more chance of it moving further up if it enters a new zone and an uncharted territory. Hence, one must buy when this happens. As the stock has got new legs to run.
2] UNDERSTANDING SUPPORT:
Say, you are driving a car uphill. Now, the car is moving slowly and steadily upwards. However, unfortunately your car runs out of fuel. Now, will you leave the car as it is and let it go down the hill with great speed or apply breaks and stop it midway?
Well, if you choose the later, then the car will stop at someplace and we can say that the hand break supported the car from falling further.
The same happens in a stock market. When a stock has fallen a lot, people who feel that the price is too low to fall further, start to buy the stock. This means that the stock price won’t fall at a certain limit. And this price level is called as ‘Support Level’.
One must buy at ‘Support Level’. This is because at this level there is more upside and less downside. Having said this, there are other associated risks too. Say, if a stock breaks it support level, this would mean that it has more room left for further downside. Hence, it will fall further, till it reaches a new ‘Support Level’.
Hence, they say, whenever a stock is at its 52 weeks low, investors must be cautious. Because, if it breaches the support level, then there will be more scope for it to fall further. So, buying a falling stock in hope of it finding the support is similar to catching a falling knife. The risk reward is high!
3] UNDERSTANDING CONSOLIDATION:
It is scary when a stock moves up or down fast in a short span of time. Hence, they say that for a stock it is very important to consolidate. Basically, ‘Consolidation’ means a stock is spending too much time in a particular zone. Hence, if the upper limit is crossed, we say that after spending too much time, the stock has now entered a new zone which will take it up further. Same is true for its downside.
A prudent person may think of buying cheap and selling at high price. But, when we study the technical terms like ‘Support’ and ‘Resistance’, we realize that when a stock crosses ‘Resistance’ it must not be sold even if the price is higher. As, it can move up further.
And when a stock breaches ‘Support’ it must not be bought even if the price is lower. As, it can go down further. In a way, we can say that there is little application of ‘Law of Demand’ in short run in stock market
These terms are used for financial market and signify a particular meaning to the financial instruments. These terms have a different value for every financial instrument and should be taken into consideration. So let us know about every term in detail:
Face value: This is the value which represents the nominal value of the company. For stocks (original cost) it is generally at 10 and for bonds (par value) 100. This value usually remains the same for stocks and is of very much importance when a company decides to do most of the corporate actions (dividends, bonus, splits, etc). It changes if the company decides to split (the value goes lower) and when the company chooses a share consolidation (the value goes higher but usually not above 10). Both of these actions happen in the form of ratios, like 1:2 or 1:5 etc, with the left value denoting the initial amount andright the final value. The face value of a company does not change due to any other reason (results, news, change in government policies, etc.)
If the face value of a company is multiplied by the shares outstanding, then we get the equity capital. For bonds the face value is the amount of money the issuer provides to the investor when it becomes mature. The face value of bonds changes along with the interest/inflation rates. It may go higher (premium) or lower (discount). In the case of zero-coupon bonds the face value is always lower while purchasing.
FACE VALUE= EQUITY SHARE CAPITAL
NO. OF SHARES OUTSTANDING
Book value: The book value of a company is the net value which is in the books. It means it is the value a company will provide to the investors if the company goes bankrupt. This value is determined by selling off all the assets and paying off the liabilitiesand dividing the left amount by the number of shares. Although not very high in comparison to the market value, but if the market value of a stock goes below the book value then it is a good buy signal. Market value (coming up next) to book value is an excellent indicator in determining if the company is overvalued or undervalued. This value helps in making a few financial ratios also like price to book value, sales to book value, etc. The value changes only due to the results shared by the company, it doesn’t get much affected by the corporate actions, news, etc.
The book value for bonds refers to the current price for the remaining coupons plus the redemption value at the coupon rate. If we need to know the price in between the coupon dates then we will not consider the value of the next coupon.
Market value: This is the value at which the stocks trade in the stock exchanges. The definition is also equally valid for bonds at the bond market. This is commonly known as Current Market Price (CMP). The market value of the stock keeps on changing (almost every second) until the stock exchanges settle down. This change of prices is due to multiple reasons such as results, news, changes in government policies, corporate actions, etc. The market value faces a drastic turn when there’s a stock split (gets halved) or share consolidation (gets doubled). The market value tells the amount that the buyer pays and seller sells for every share that is purchased or sold. In cases of high volatility speculators earn good money. This value helps us in determining the capitalization of a company by simply multiplying it with the number of shares outstanding. A very high market value does scare a lot of investors/speculators but shouldn’t be bothered if we know how well is the company performing. Some companies due to either about to wind up or due to some other reasons have a very low market value and they are often called pennies (penny stocks). This value is not only used in financial instruments but in every possible thing like groceries, cattle, property, etc.
Intrinsic value: It is the actual value that the investor decides to pay/get for the investments. This is also the value which is commonly known as the discounted value of the future benefits.“It is the discounted value of the cash that can be taken out of a business during its remaining life.” This is the famous quote by the great investor Warren Buffet. Although it is tough to calculate but if someone knows how to, then that person will soon become the king of investments. If the intrinsic value is perceived to be lower than the market value then the investment is said to be overvalued and vice versa. This value is determined by qualitative and quantitative analysis. Therefore, this value is regarded as a part of the valuation and not the fundamental value or technical value. The intrinsic value is mostly calculated for stocks and other investable instruments (that provide capital appreciation).
So, while reading any financial reports or analyzing the value of a company, an investor should be careful about the type of value he/she is using as it can significantly affect the decisions to be taken.
The Price to Book (P/B) Ratio is used to compare a company’s market price to book value and is calculated by dividing price per share by book value per share.
The price-to-book ratio measures a company’s market price in relation to its book value. The ratio denotes how much equity investors are paying for each rupee in net assets.
Book value, usually located on a company’s balance sheet as “stockholder equity,” represents the total amount that would be left over if the company liquidated all of its assets and repaid all of its liabilities.
Formula:-
Book value = Net Worth
Book Value per Share = Book Value / Total number of shares
P/B Value Ratio = Market Price per Share / Book Value per Share
Use of Book Value per Share:-
The book value per share may be used by some investors to determine the equity in a company relative to the market value of the company, which is the price of its stock.
For example, a SMG Ltd company that is currently trading for Rs. 200 but has a book value of Rs. 100 is selling at twice its equity. This example is referred to as price to book value (P/B), in which book value per share is used in the denominator. In contrast to book value, the market price reflects the future growth potential of the company
There are basically two methods to calculate the book value,
1. Liability Side Approach:
Under this approach the book value is calculated by adding The Share capital and Reserves & surplus which nothing but the Net worth of the firm.
Book Value = Net Worth (Shareholders’ fund)
2. Asset Side Approach:
Under this method we calculate the book value by subtracting the outsiders’ liabilities (Non current liabilities and Current liabilities) and the fictitious assets from the Total assets.
Book Value = (Total assets – Fictitious assets) – Outsiders’ liability
If you ask me, I personally prefer the Asset Side Approach to measure the book value.
Reason??
This is because when we calculate the book value by liability side approach; we don’t deduct the Fictitious assets value.
Fictitious assets are current assets which have no market value but just created out of some miscellaneous expenditures such as preliminary expenses, loss on issue of shares, discount on issue of debentures etc.
So considering them in book value makes NO SENSE.
Now to calculate book value per share just divide Book value by the total number of outstanding shares.
That is, Book Value per share = Book Value / No. of outstanding shares