When it comes to safe investment options, few instruments can rival the security and dependability of RBI Floating Rate Bonds. These bonds are ideal for those who prioritize steady returns without worrying about market volatility. In this post, we’ll break down everything you need to know about RBI Floating Rate Bonds and why they could be a perfect addition to your financial portfolio.
What Are RBI Floating Rate Bonds?
RBI Floating Rate Savings Bonds, 2020, are government-backed investment instruments that offer variable interest rates. The unique feature of these bonds is their semi-annual interest rate adjustment, which ensures that the returns remain competitive with prevailing market rates.
With the assurance of the Reserve Bank of India, these bonds are a safe haven for risk-averse investors.
Key Features of RBI Floating Rate Bonds
1. Eligibility to Invest
Who can invest?
Indian residents and Hindu Undivided Families (HUFs).
Minors, with the help of a guardian, can also invest.
This inclusivity makes these bonds accessible to a wide range of investors.
2. Tenure and Lock-In Period
Tenure: 7 years from the date of issue.
Senior Citizen Benefits: Reduced lock-in periods based on age:
80+ years: 4 years
70–80 years: 5 years
60–70 years: 6 years
3. Interest Rate
Linked to the National Savings Certificate (NSC) rate + 0.35%.
Example: If NSC’s rate is 7.1%, the bond’s interest rate will be 7.45%.
Interest is paid semi-annually on January 1 and July 1, providing regular income without reinvestment worries.
4. Minimum and Maximum Investment
Minimum: ₹1,000 (and in multiples thereof).
Maximum: No upper limit, making it an excellent choice for parking surplus funds.
Benefits of RBI Floating Rate Bonds
1. Safety and Security
Being government-backed, these bonds are one of the safest investment options in India, free from the risk of default.
2. Market-Linked Returns
The floating interest rate ensures that your investment remains competitive with changing market rates.
3. Regular Payouts
Semi-annual interest payments provide a predictable income stream for investors, especially retirees.
4. Flexibility for Senior Citizens
The reduced lock-in period for senior investors ensures liquidity when needed most.
Tax Implications
The interest earned is fully taxable as per your income tax slab.
Tax is deducted at source (TDS), simplifying compliance for investors.
How to Invest in RBI Floating Rate Bonds
Investing in these bonds is straightforward:
Visit a nationalized or select private bank, or the Stock Holding Corporation of India Limited (SHCIL).
Submit the required forms and KYC documents.
Make the payment (minimum ₹1,000).
Receive your investment certificate, which serves as proof of ownership.
Many banks also offer online investment options through their net banking portals.
Who Should Invest in RBI Floating Rate Bonds?
These bonds are ideal for:
Risk-averse investors seeking stable returns.
Retirees who prefer a predictable income stream.
Those looking to diversify their portfolio with safe, fixed-income instruments.
Final Thoughts
RBI Floating Rate Bonds are a blend of safety, flexibility, and reliable returns. They are an excellent choice for anyone who prioritizes capital preservation while still earning market-linked returns.
Whether you’re planning for retirement, looking for a steady income stream, or simply aiming to diversify your investments, these bonds are worth considering.
Start your journey toward secure investments today! Contact your bank or financial advisor to learn more about investing in RBI Floating Rate Bonds.
Did you find this guide helpful? Share it with your friends and family to spread awareness about safe investment options!
A Systematic Transfer Plan (STP) is like a smart way to move your money from one place to another, little by little, over time. Let’s break it down in a way that’s super easy to understand, just like explaining it to a 10-year-old.
Imagine You Have Two Piggy Banks:
Piggy Bank 1: This is your safe piggy bank where you keep your money. It’s like the money your parents give you that you don’t want to lose, so you put it somewhere safe.
Piggy Bank 2: This is your adventure piggy bank. It’s for trying to grow your money by taking a little bit of risk. It’s like using your money to play a game where you could win more, but you could also lose a bit sometimes.
Now, let’s say you want to move your money from Piggy Bank 1 (safe) to Piggy Bank 2 (adventure), but instead of moving all your money at once, you want to do it slowly. This way, even if the game is tough some days, you won’t lose all your money at once. That’s where the Systematic Transfer Plan (STP) comes in!
How Does STP Work?
Here’s how it works, step by step:
You start with money in Piggy Bank 1 (the safe bank): This is where your money is kept safe, like in a bank account or a debt mutual fund (which is less risky).
You decide to move some money every month: Instead of taking all your money out of the safe piggy bank and putting it into the adventure piggy bank, you decide to move a small amount of money every month.For example, if you have ₹1,000 in Piggy Bank 1, you can move ₹100 to Piggy Bank 2 each month.
Each month, some money is moved: Every month, ₹100 is taken from the safe bank (Piggy Bank 1) and moved to the adventure bank (Piggy Bank 2). Over time, all your money from Piggy Bank 1 will get transferred to Piggy Bank 2.
Why do this?: By moving money slowly, you don’t have to worry about the adventure bank (Piggy Bank 2) going up or down too much in one day. If one day the market (the game) isn’t doing well, only a little of your money is there, and the rest is still safe in Piggy Bank 1. This makes the risk of losing money smaller.
Example:
Let’s say you have ₹12,000 in Piggy Bank 1. You decide to move ₹1,000 every month to Piggy Bank 2 for the next 12 months.
In Month 1, ₹1,000 moves to Piggy Bank 2.
In Month 2, another ₹1,000 moves to Piggy Bank 2.
And this keeps happening until after 12 months, all ₹12,000 has been transferred.
Now, if during some months the game (market) was tough, your Piggy Bank 2 didn’t lose too much because you didn’t put all your money there at once.
Why is STP Helpful?
Reduces Risk: Moving money slowly protects you from losing a lot of money at once if things go wrong.
Helps Your Money Grow Steadily: You get a chance to invest when the market is low and when it’s high, balancing out the risk.
More Control: You control how much you move each month, making it a smart and safe way to invest in risky things.
STP is Like…
Think of STP as dipping your toe into a swimming pool instead of jumping in all at once. If the water (market) is too cold or too hot, you can slowly get used to it and not have a big shock!
In the world of money, STP is a way to slowly invest in something that has a chance to grow your money while keeping the rest of your savings safe.
First of all let me ease this for everyone – We need to understand what are mutual funds. Here is a detailed answer for everyone who don’t know what are mutual friends.
Consider this conversation between father and son. The curious teenager seeks advice from his Dad on Mutual funds. In the process, he realizes the importance of the same.
(Few references are taken from TVF’s show ‘Yeh Meri Family’)
Son: Dad, what is a Mutual fund?
Dad: Do you know how to drive?
Son: No.
Dad: But, if you have a car and you don’t know how to drive, how will you reach your destination?
Son: It is simple Dad. I’ll hire a driver for me.
Dad: That’s exactly why we need mutual funds. You see son, investing in the stock market is a risky business. It is an art. If you know how to drive, then you do not need a driver. But, if you don’t know how to drive, you will need one. Mutual funds are managed by experts. And people who do not want to take the risk of investing their money all by themselves, rely on the Mutual funds which are managed by the experts. It is akin to relying on a driver in case you do not know how to drive.
Son: Where is the money invested by the mutual funds?
Dad: There are different kinds of Mutual funds. Some invest only in equities, some invest in equities and debentures. Then there are other mutual funds who also put some money in gold and bonds.
Son: But how to know which category is best suited?
Dad: Okay, can you answer this simple question: ‘For how many minutes do you boil the milk?’
Son: Umm, 5–10 minutes may be! Or 15 minutes!
Dad: There is no one answer to this question. The answer depends on the fact as to for what purpose you are boiling the milk? If you want to drink the milk, then you boil it for 5 minutes. But, if you are making some dessert, then you would probably boil it for 15 minutes. You see, the same theory applies in case of selecting the category of a Mutual fund. If your investment goal is short term, say buying a car, then a hybrid of debt and equity would be more suitable as it is less risky and you need back the money in a less span of time. But, if your goal is something like marriage of your kids then equity oriented mutual funds are better suited. This is because over a longer period of time, equity can give handsome returns.
Son: But Dad, I don’t have much money to put in the Mutual funds. What should I do?
Dad: That’s the best part of investing in a Mutual fund. You can start even with Rs.1000 a month. You can increase the amount to be invested as and when you have more money. Mutual Funds have a huge inflow of money from people like us and hence even with the investment of Rs.1000 a month, you will be able to buy shares of companies whose share price is more than Rs.1000.
Son: Don’t you feel it is a bit early for a teenager like me to put the money so early?
Dad: No son. It is never too early to invest in Mutual funds. We can not time the market. Hence, it is always better to start early. Plus, the power of compounding will help your fund to grow exponentially. All you need to have is discipline. Do not time the market but give your time to the market. In a cricket match a huge score can be chased even by singles and doubles if we are disciplined.
Son: What should I do in case of a stock market crash.
Dad: You can invest the money in the Mutual funds in two ways: Lump-sum amount or through SIP (Systematic Investment Plan). It is recommended to put the money through SIP. In case of an unstable market environment, you can avoid the risk of putting a lot of money at once if you follow the SIP route of investment. In case of a stock market crash, it is always recommended to continue your SIP. In longer term you will realize that you have gained a lot owing to buying the stocks at a cheaper price during the crash.
Son: Thanks! That was a lot to learn. I’ll be starting the investment as early as possible.
Now coming to the point Which is the best mutual fund to invest and why?
Everyone will have there own answer for this but here is my recommendation for the mutual fund I myself have invested it is – HDFC Balanced Advantage Fund
What is Balanced advantage fund?
Balanced Advantage Fund is a type of mutual fund that uses a dynamic asset allocation strategy to keep a balance between equity and debt investments. By investing in BAF, an investor can help from market volatility as the fund manager uses the flexibility to shift between equity and debt instruments based on market conditions.
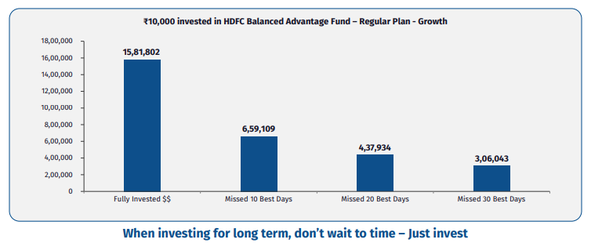
Now coming to the point – Why HDFC Balanced Advantage Fund ?
In the journey of ~ 30 years,₹1,00,000 has grown to ₹1.58 crore at CAGR of ~18%
Monthly SIP of ₹10,000 on the first business day of every month in the Scheme since start has grown to ₹12.89 crore
Helps to achieve twin objectives through one scheme:
Growth of Capital by investing in Equities
Stability of Capital by investing in Debt Equities
have potential to create long term wealth and beat inflation over a long term
The scheme is comparatively less volatile than Equity schemes due to debt component Aims to create wealth with dynamic asset allocation between equity and debt
The investment framework is based on valuations, assessment of macro scenario and bottom-up assessment of investment opportunities
From the above content, it will be quite clear to you that time in, not timing can be a long term success so I will suggest you to invest in mutual funds through Systematic Investment Plan.
I have already recommended itself that the best time to invest was 20 years ago, the next best time to invest is now. You can directly open an SIP online and start within 5 minutes, to open and start investing now – https://investor-web.hdfcfund.com/RT/13072024050647
Firstly, let us understand the importance of ‘Quarterly Results’.
The shareholders of the company have put their hard earned money in the company. So, they must know about the affairs of the company. However, they can not have access to the books of accounts of the company. This is because, only and only the management of any company can access the books.
Hence, to give a snapshot of company’s financial performance, listed companies are required to publish ‘Quarterly Results’, which are available in public domain.
Also, before we start the details, one must have a basic understanding of ‘Financial Year’ and ‘Quarters’.
A financial year normally starts from 1st April and ends on 31st March the following year. This is divided into 4 equal periods, each one is a ‘Quarter’, consisting of 3 months.
Q-1 is a period from 1st April to 30th June,
Q-2 is a period from 1st July to 30th September,
Q-3 is a period from 1st October to 31st December,
Q-4 is a period from 1st January to 31st March.
Also, after 30th September, i.e Q-2, one can get the analysis of half financial year (H-1). So, H-1 is a period from 1st April to 30th September and H-2 is a period from 1st October to 31st March.
As per SEBI guidelines, every listed company needs to publish quarterly results in 45 days after the quarter end except the last quarter.
To sum up,
Please note that it is companies which have a custom of uploading the quarterly results as early as possible are the ones which do not have anything to hide or cook. For instance, the entire earnings season starts with giants like Infosys and TCS.
On the other hand, whenever a company delays the quarterly results or postpones them after announcing a date, must trigger caution for an investor. For instance, Yes Bank delayed its quarterly results for the Q-3 of FY 2019–20, which ended on 31st December 2019. It filed the results on March 14, 2020.
And we all know of all the major developments that took place before the results.
Also, in past there have been companies fined by SEBI for not filing the quarterly results altogether. The names include infamous companies like Gitanjali Gems, Amtek Auto, etc.
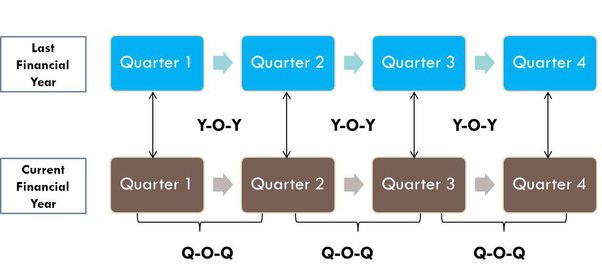
For the uninitiated, Q-O-Q stands for Quarter on Quarter and Y-O-Y stands for Year on Year.
When we compare the numbers of a company on sequential basis, i.e. on Q-O-Q basis, we are comparing Q-2 of current financial year with Q-1 of same financial year. Thus, we would be able to judge the performance of a company and make a conclusion if or not it is performing better this quarter compared to the immediately preceding quarter.
On the other hand, in Y-O-Y basis, we are comparing Q-1 of current financial year with Q-1 of last financial year.
To sum up,
So, which comparison is correct? Q-O-Q or Y-O-Y?
The answer depends on the sector to which the company belongs. In case of cyclical stocks or companies which are seasonal, there may be a quarter where the company performs best compared to other quarters. For instance, in case of Auto companies, the ‘Diwali’ quarter is the best one. Hence, comparing the numbers on Y-O-Y basis makes more sense because of a strong second half (H-2). So is the case with Steel, Power and Cement companies, where Y-O-Y comparisons must be done.
However, in case of Telecom companies or IT companies, Q-O-Q comparison makes more sense. The reason is the fact that these companies do not have any seasonality.
Also, YTD (Year to Date) comparisons are quite useful. YTD helps us in analyzing the performance of the company from the start of the financial year till the date quarter. Hence, the YTD numbers for Q-3 will have numbers from 1st April to 31st December.
P.S : The entire year 2020 was an exceptional year due to covid. Hence, in F.Y 2020–21, comparing the numbers on Y-O-Y basis won’t make any sense as the base is too small.
Stock price more often than not react to quarterly result of a company. Also, note the below interesting observations :
Even if there is increase in profits on Q-O-Q or Y-O-Y basis, the stock can tank because market expectations is an important factor. If the profits are below expectations, the stock will fall.
Even if the performance of a company is above expectations of street, the stock may still fall after results. This may be because it people were anticipating good results and the stock already rallied before the results. That’s why the saying : ‘Buy the rumour, sell the news’.
Sometimes, even after a bad result, the stock may still rally. This may be because of good management commentary. Do note that it is not mandatory for the companies to give guidance or commentary of their plans.
The following aspects are worth comparing when a company announces quarterly results:
A. ANALYSIS OF PROFIT AND LOSS ACCOUNT
The topline of company (Gross and Net Sales)
Volume (quantity)
Price of goods (quality)
Operating Income
EBITDA
EBIT
Margins
The bottom line of company
Net Profit
Net Profit Margins
EPS
B. ANALYSIS OF BALANCE SHEET
Sources of Funds
Application of funds
C. ANALYSIS OF CASH FLOW STATEMENT
Inflow of cash
Outflow of cash
D. COMMENTS OF THE AUDITOR
E. NOTES
In this post, I will be trying to cover mainly the analysis of profit and loss account.
1. Topline of the company :
Gross Sales: Gross sales indicates the total sales of the company before discounts and returns from customers. Gross sales shows how the company is performing operationally. It depends on
Volume: Which refers to the total number of units sold. Larger number represents good market penetration.
Price: Higher price shows that the company is having good command and customer loyalty.
Net Sales: Net Sales indicates the sales of company after discounts and returns.
2. Operating Income and Net Profit:
To understand the entire concept of operating income, let us understand this example in detail.
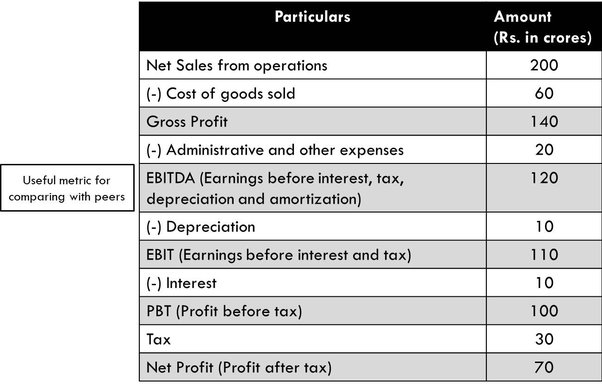
EBITDA or Earnings before interest, tax, depreciation and amortization helps one to understand how the company is going through its regular business activities, i.e. its operations.
Please note that in EBITDA numbers, we have not deducted interest on borrowings, depreciation on assets and amortization on intangibles like goodwill. This is because different companies from same sector may have different amounts and dates of buying fixed assets, different finance structures, etc. Hence, EBITDA numbers help one to compare the numbers with peers for understanding the financial performance of the company.
EBTDA margin in this case are 60%. It is calculated by dividing EBITDA by Sales. Again this is useful for comparing with peers.
EBIT is calculated by subtracting depreciation from EBITDA. Further, one can calculate PBT by deducting interest from EBIT. And finally Net Profit (PAT) is arrived at by deducting tax from PBT.
Net Profit helps one to understand the individual performance of a company. This can again be compared on Q-O-Q or Y-O-Y basis as discussed previously. This is nothing but the bottom line of the company.
Note: Sometimes company may earn revenue which are not from operations, such as rental income or income from investments. These numbers must be ignored when we focus on operating profits.
3. Margins
In the above case, the net profit margin comes to 35%. It is calculated as Net Profits divided by Sales.
Net Profit margin gives an idea of the overall financial position of the company and how well the company has managed to contain the costs. Also, if the net profit margins of a company are fluctuating then investor must look for the reasons such as one off income or expenses.
4. EPS
EPS is Earnings Per Share. It is calculated as Net Profit of the company divided by the total number of outstanding shares.
It helps investor in knowing how much a company earns for every share.
Also, if we multiply EPS by PE ratio we get the Market Price per share. For understanding PE ratio, one may refer this post: Apples, Oranges And P/E Ratio.
It is important to note that every company has to present audited financial statements only at the end of the financial year.
So, for quarterly results, companies can present unaudited financials.
However, comments of the auditor if any must be taken and read seriously. An auditor is a professional who bridges the gap between company and the shareholders.
I had a similar question when I thought to diversify my portfolio to cryptocurrency, After a lot of research I zeroed on these factors and selected my cryptoexchange
Security
The first and foremost thing you should look for is security. Despite the fact that bitcoin is developing at unprecedented rates, there have been a number of cyber-attacks and digital heists in which hackers stole large sums of money and then vanished.
Check to see if the exchange site is HTTPS or HTTP. HTTPS indicates that the site uses secure protocols. What type of wallet does the exchange offer? Is there cold wallet storage or hot wallet storage? Because it works offline and is physical, cold wallet storage is more secure. Hot wallets, on the other hand, may be the best option for regular transactions. Other factors to consider are if the exchange provides secure logins, whether two-factor authentication is used, and so on.
Volume and Liquidity
Another critical issue to consider is liquidity. A higher liquidity level indicates that the exchange is more stable. If a cryptocurrency exchange is unable to complete a transaction or fulfill an order, it is most likely due to a liquidity shortage. A crypto exchange with sufficient liquidity, on the other hand, allows traders to complete their transactions quickly and easily. As a result, traders and cryptocurrency exchanges will be protected from market fluctuations.
Exchange and Transaction Fees
Essentially, cryptocurrency exchanges function as an intermediary between the buyer and seller by facilitating the exchanging of cryptocurrencies for other assets. As a result, they mostly profit from commissions and transaction fees.
Given that crypto exchanges require a large amount of capital to operate in addition to offering a secure trading environment, some crypto trading platforms may be justified in charging high transaction fees. However, in order to make big profits, numerous crypto exchanges frequently charge double the fees required, and most users are unaware of this. This is why, before making a final decision, individuals should always perform research and compare exchange and transaction fees across various trading platforms. Otherwise, there’s a good chance that you will get ripped off.
Other than these, users should also consider other factors such as ease of using the trading platform, user experience and navigation, and transparency of the exchange before they get started on their crypto trading journey.
Why WazirX is the best bitcoin trading platform in India
Best-in-class security – In order to make WazirX India’s most secure exchange, the platform undertakes regular security audits to ensure that no security flaws are overlooked.
Quick KYC procedures – Wazir has industry-leading identity verification solutions with significantly reduced verification timeframes.
Fast transactions – With the potential to handle over a million transactions, the platform architecture can readily scale up in seconds to meet demand.
Integration across various platforms – WazirX is supported on Web, Android, iOS, macOS, and Windows. WazirX trading app is available on Google Play Store and App Store.
Easy user navigation – The platform includes a simple and easy-to-navigate interface that makes it easier for users, especially beginners, to start trading. The interface also makes it simple for users to go through the various options, whether you wish to deposit or withdraw money.
Low transaction fees – WazirX continues to attract more customers with each passing day thanks to significantly cheaper transaction fees than other platforms.
Supports global currencies – WazirX is integrated with the Binance app to allow for global currency investing.
Own utility token – WazirX also has its own utility token, the WRX, which can be used to pay the transaction fees.
Availability of more than 150+ cryptocurrencies and 140+ trading pairs – WazirX allows you to trade in any major cryptocurrency, including Bitcoin, Litecoin, Ethereum, and even the WRX token, thanks to its availability of over 150 cryptocurrencies and 140 trading pairings.
P2P Trades – WazirX also has a peer-to-peer (P2P) trading engine that matches users to trade with one another.
My priority when it comes to buying cryptocurrencies is that I want to grab the best market price on each of my purchases.
That’s why I choose WazirX, which is one such exchange that helps me achieve my goal of fetching the best prices.
Because it is not just another exchange but a crypto aggregator that pools liquidity from some of the top exchanges in the world and presents the best rate on its app for every buys and sell, apart from that their customer support is also very hands-on and thus it is my preferred choice.
Other notable features of WazirX are:
Liquidity
With respect to liquidity, WazirX is still on its way up. The exchange had a 24-hour trading volume of USD 3.37 million, placings it on place no. 153 on the list of the exchanges in the world with the highest 24-hour trading volumes.
WazirX Fees
WazirX Trading fees
The fees at WazirX are what we call flat fees, meaning that makers and takers are charged the same fee. WazirX’s fees are 0.20% for both takers and makers. This is in line with the industry average, which has historically been around 0.25%. Today, which is quite normal.
WazirX Withdrawal fees
WazirX charges a withdrawal fee amounting to 0.0005 BTC when you withdraw BTC. This fee is below the global industry average and thus constitutes a competitive advantage against the majority of other top crypto exchanges in the market. The global industry average is 0.000812 BTC per BTC-withdrawal, so WazirX is roughly 40% lower than that.
WazirX Security
This is actually the only place where this particular cryptocurrency exchange takes the “gold medal” among Indian cryptocurrency exchanges. The security score received by this Indian cryptocurrency exchange site is C when performing the test at Observatory by Mozilla. No other Indian cryptocurrency exchange has a higher security score. A “C” is also in line with the global industry average.
If u want to join WazirX, Join with my referral code ksppe42b, you will get an extra 1 WRX or alternatively open an account online – Click here
I personally feel WazirX is the best for trading cryptocurrencies in India. WazirX looked to me like a fresh grad student out of the university, who felt that he could take on the world right then. But the fact that Binance had acquired WazirX, elevated its status in front of my eyes. Intuitively, I started researching WazirX. And the more I read, the more still the raging waters turned in my mind. Without waiting for another night, I created my account on WazirX.
Apart from this, the association of Binance with WazirX provides its legitimate security. So far I can undoubtedly say that I am happy with my decision.
A Systematic Investment Plan or SIP is a smart and hassle free mode for investing money in mutual funds. SIP allows you to invest a certain pre-determined amount at a regular interval (weekly, monthly, quarterly, etc.). A SIP is a planned approach towards investments and helps you inculcate the habit of saving and building wealth for the future.
A SIP is a flexible and easy investment plan. Your money is auto-debited from your bank account and invested into a specific mutual fund scheme.You are allocated certain number of units based on the ongoing market rate (called NAV or net asset value) for the day.
Every time you invest money, additional units of the scheme are purchased at the market rate and added to your account. Hence, units are bought at different rates and investors benefit from Rupee-Cost Averaging and the Power of Compounding.
With volatile markets, most investors remain skeptical about the best time to invest and try to ‘time’ their entry into the market. Rupee-cost averaging allows you to opt out of the guessing game. If are a regular investor, your money fetches more units when the price is low and lesser when the price is high. During volatile period, it may allow you to achieve a lower average cost per unit.
Other Benefits of Systematic Investment Plans
Disciplined Saving – Discipline is the key to successful investments. When you invest through SIP, you commit yourself to save regularly. Every investment is a step towards attaining your financial objectives.
Flexibility – While it is advisable to continue SIP investments with a long-term perspective, there is no compulsion. Investors can discontinue the plan at any time. One can also increase/ decrease the amount being invested.
Long-Term Gains – Due to rupee-cost averaging and the power of compounding SIPs have the potential to deliver attractive returns over a long investment horizon.
Convenience – SIP is a hassle-free mode of investment. You can issue a standing instruction to your bank to facilitate auto-debits from your bank account.
SIPs have proved to be an ideal mode of investment for retail investors who do not have the resources to pursue active investments. There is no single mutual fund to call as ‘best fund’, as there are many well performing funds over a longer period of 5 to 10 years and invested through SIP mode.
SIPs have proved to be an ideal mode of investment for retail investors who do not have the resources to pursue active investments. There is no single mutual fund to call as ‘best fund’, as there are many well performing funds over a longer period of 5 to 10 years and invested through SIP mode.
Generally SIP returns of good mutual funds have been between 12-18%. The actual returns might differ for different investors. But for this discussion, let’s be conservative and assume the average SIP returns in 5, 10, 15 or 20 years to be 12% per annum.
Here is what a Rs 10,000 per month SIP in mutual funds can do over the years:
5 year SIP of Rs 10,000 monthly = Rs 8.05 lakh
10 year SIP of Rs 10,000 monthly = Rs 21 lakh
15 year SIP of Rs 10,000 monthly = Rs 41.93lakh
20 year SIP of Rs 10,000 monthly = Rs 75.6 lakh
25 year SIP of Rs 10,000 monthly = Rs 1.29crore
30 year SIP of Rs 10,000 monthly = Rs 2.1 crore
Wow, on a mere investment of 36 lakh rs in the course of 30 years with easy installments you will be able to amass 2.1 crore rs.
It’s a measure of the traders’ expectation of the rate of change in stock prices in the near-term(Current month & a portion of the next month). It is also known as the fear index as it indicates the uncertainty amongst market participants. In India, the Volatility Index is calculated based on the calculation mechanism adopted by the Chicago Board Options Exchange (CBOE) by using the bid/offer prices of NIFTY ATM Options Prices.
What to make sense of the VIX levels?
When Vix goes up → It means that traders are willing to pay more to get the right to buy the underlying. In essence, they foresee the risks increase in the near future. Try looking at it from an insurance buyer’s mindset. When the perceived risk is high, the buyer is willing to pay more to cover that risk.
When Vix goes down → It means that traders are willing to pay less to acquire the right to buy the underlying. In essence, they foresee the risks to reduce or remain low in the near future. In insurance analogy, when the perceived risk is low and there is complacency, the willingness to pay for insurance reduces, the prices reduce.
Sudden Spikes → Historically, India Vix has not spiked above 40 despite many sudden uncertainties in the market. However, when there is a fear of epic proportions, the levels have gone above and beyond 40. Such times are considered the riskiest and unpredictable when compared to other uncertainties that are part and parcel in the marketplace.
Can VIX is useful to make position in options?
It is very logical question, VIX is useful to me to create my option position. The answer is YES, by studying VIX we can ascertain the risk involved in stock market. In last 3 days as on 25 Feb the VIX was at high because of air strike done by Indian air force.
In a week period I.e. 1st March today VIX fall almost 20% from pick. So, market is showing some strength and almost every stock option fall drastically due to fall in VIX. Take any name reliance volatility was 29 and during day it reach to 26, so vix is common parameter to study overall market fear.
A right is actually an abbreviation for the full form “Right of first refusal”. It is an option given to the existing shareholders to invest in a public issue of the company in proportion to their existing shareholding.
It is given as a privilege to the current investors to increase their holding in the company. You can think of it as a loyalty program of sorts. The option’s time value (subscription period) in India is between 15 – 30 days depending on the company. It cannot extend beyond 30 days as per the securities law.
The right to subscribe is non-transferable and if shareholders don’t do it within the stipulated time-frame, it expires. To lure shareholders to buy in the rights issue, companies issue shares at a discount to the market price. The long-term shareholders tend to subscribe for these issues if they don’t want their % ownership of the company to get diluted.
Why do companies do Right issue?
The main reason is to keep its shareholding structure unchanged!
Rights issues are a classic way to keep away from new activist investors, hostile acquiring attempts from competitors, corporate raiders etc. Unlike an IPO, a rights issue is a silent affair which does not attract any attention of the outside world.
A company that wants to do a rights issue must only issue a public notice in 3 newspapers (English, Hindi & regional). Usually, these advertisements are stuck in the notice board part of the paper which hardly invites any attention.
This source of funding is especially useful for companies that have a large promoter holding with a narrow shareholder base. Raising equity becomes easy and inexpensive through this route.
Net asset value(NAV) is the value of a fund’s asset less the value of its liabilities such as operating expenses, marketing expenses, management fees, among other permissible expenses and charges per unit. NAV = (Value of Assets-Value of Liabilities)/number of units outstanding.
Let us assume I run a company. I have a factory, land property across the country, 100 Four Wheeler vehicle, 25 heavy pieces of machinery and I have borrowed a loan of Rs. 100/- from a bank. The company has 100 shares outstanding in the market.
The value of a factory is Rs. 1000/-, the value of a land property is Rs. 200/-, the value of 100 four wheeler vehicle is Rs. 100/- and the value of 25 heavy pieces of machinery is Rs. 500/-.
So my company’s total asset is = 1000 + 200 + 100 + 500 = Rs.1800/-
Since I have borrowed Rs. 100/- from the bank this is my liability which is to be repaid whether in the long term or short term.
So the company NAV is = 1800-100/100 = 1700/100 = 17
How to calculate the Fund NAV: The Mutual Fund invests the money in many different sectors and a bunch of companies to minimize the risk and diversify the portfolio.
Let us assume one large cap fund invests the money in 5 companies. So the companies NAV is different. To calculate the fund NAV you have to sum the respective company NAV and just average. Then you get the respective fund NAV. The companies in which the money is invested are Maruti Suzuki (NAV 400), Titan Company (NAV 300), State Bank of India (NAV 500), HPCL (NAV 500), and Interglobe Aviation ( NAV 300).
So, the Fund NAV is = ( 400 + 300 + 500 + 500 + 300 )/ 5 = 400.